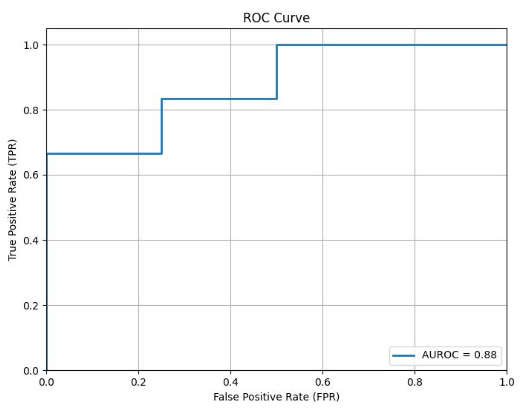
ROC Curve
import numpy as np
from sklearn.metrics import roc_auc_score, roc_curve
import matplotlib.pyplot as plt


def main(
    true_labels: np.ndarray,
    predicted_pb: np.ndarray,
    figimg_path: str="auroc.jpg"
):

    auroc = roc_auc_score(true_labels, predicted_pb)
    fpr, tpr, thresholds = roc_curve(true_labels, predicted_pb)

    plt.figure(figsize=(8, 6))
    plt.plot(fpr, tpr, linewidth=2, label=f'AUROC = {auroc:.2f}')
    plt.xlim([0.0, 1.0])
    plt.ylim([0.0, 1.05])
    plt.xlabel('False Positive Rate (FPR)')
    plt.ylabel('True Positive Rate (TPR)')
    plt.title('ROC Curve')
    plt.legend(loc="lower right")
    plt.grid()
    plt.savefig(figimg_path)


if __name__ == '__main__':

    true_labels = np.array(
        [0, 1, 1, 0, 1, 0, 1, 0, 1, 1]
    )
    predicted_pb = np.array(
        [0.2, 0.7, 0.8, 0.3, 0.6, 0.1, 0.9, 0.4, 0.32, 0.25]
    )

    auroc = main(
        true_labels,
        predicted_pb
    )
    print("AUROC:", auroc)
PRO : Per-Resion Overlap
“PRO” represents the True Positive Rate (TPR) in the Ground Truth region. It’s kind of metrics that is similar to mIoU, which evaluates the predictions on ground truty labels.
This link is helpful to understand.
https://qiita.com/bezilla/items/55ff2faf2704267eab33