I have been developing moirestrain, a small NumPy-first Python package for sampling moire analysis of periodic grating images. This article focuses on one concrete result from the README: detecting a partial square-grid patch inside a larger image and recovering strain fields from it.
The example is synthetic, so the true displacement and strain fields are known. That makes it useful for checking whether the full workflow is behaving as expected: ROI detection, phase analysis, displacement estimation, and strain recovery.
What the Example Does
The input is not just a clean cropped grid. Instead, the grid appears as a patch inside a larger background image. The analysis workflow is:
- Generate a larger synthetic image with a partial square-marker grid patch.
- Detect the grid region using a grating-energy map.
- Crop the detected ROI.
- Separate the square-grid image into x-periodic and y-periodic components.
- Apply phase-shifted sampling moire analysis in both directions.
- Convert phase differences to displacement fields
uandv. - Differentiate the displacement fields to estimate
exx,eyy, andgamma_xy. - Compare the measured strain fields with the known synthetic truth.
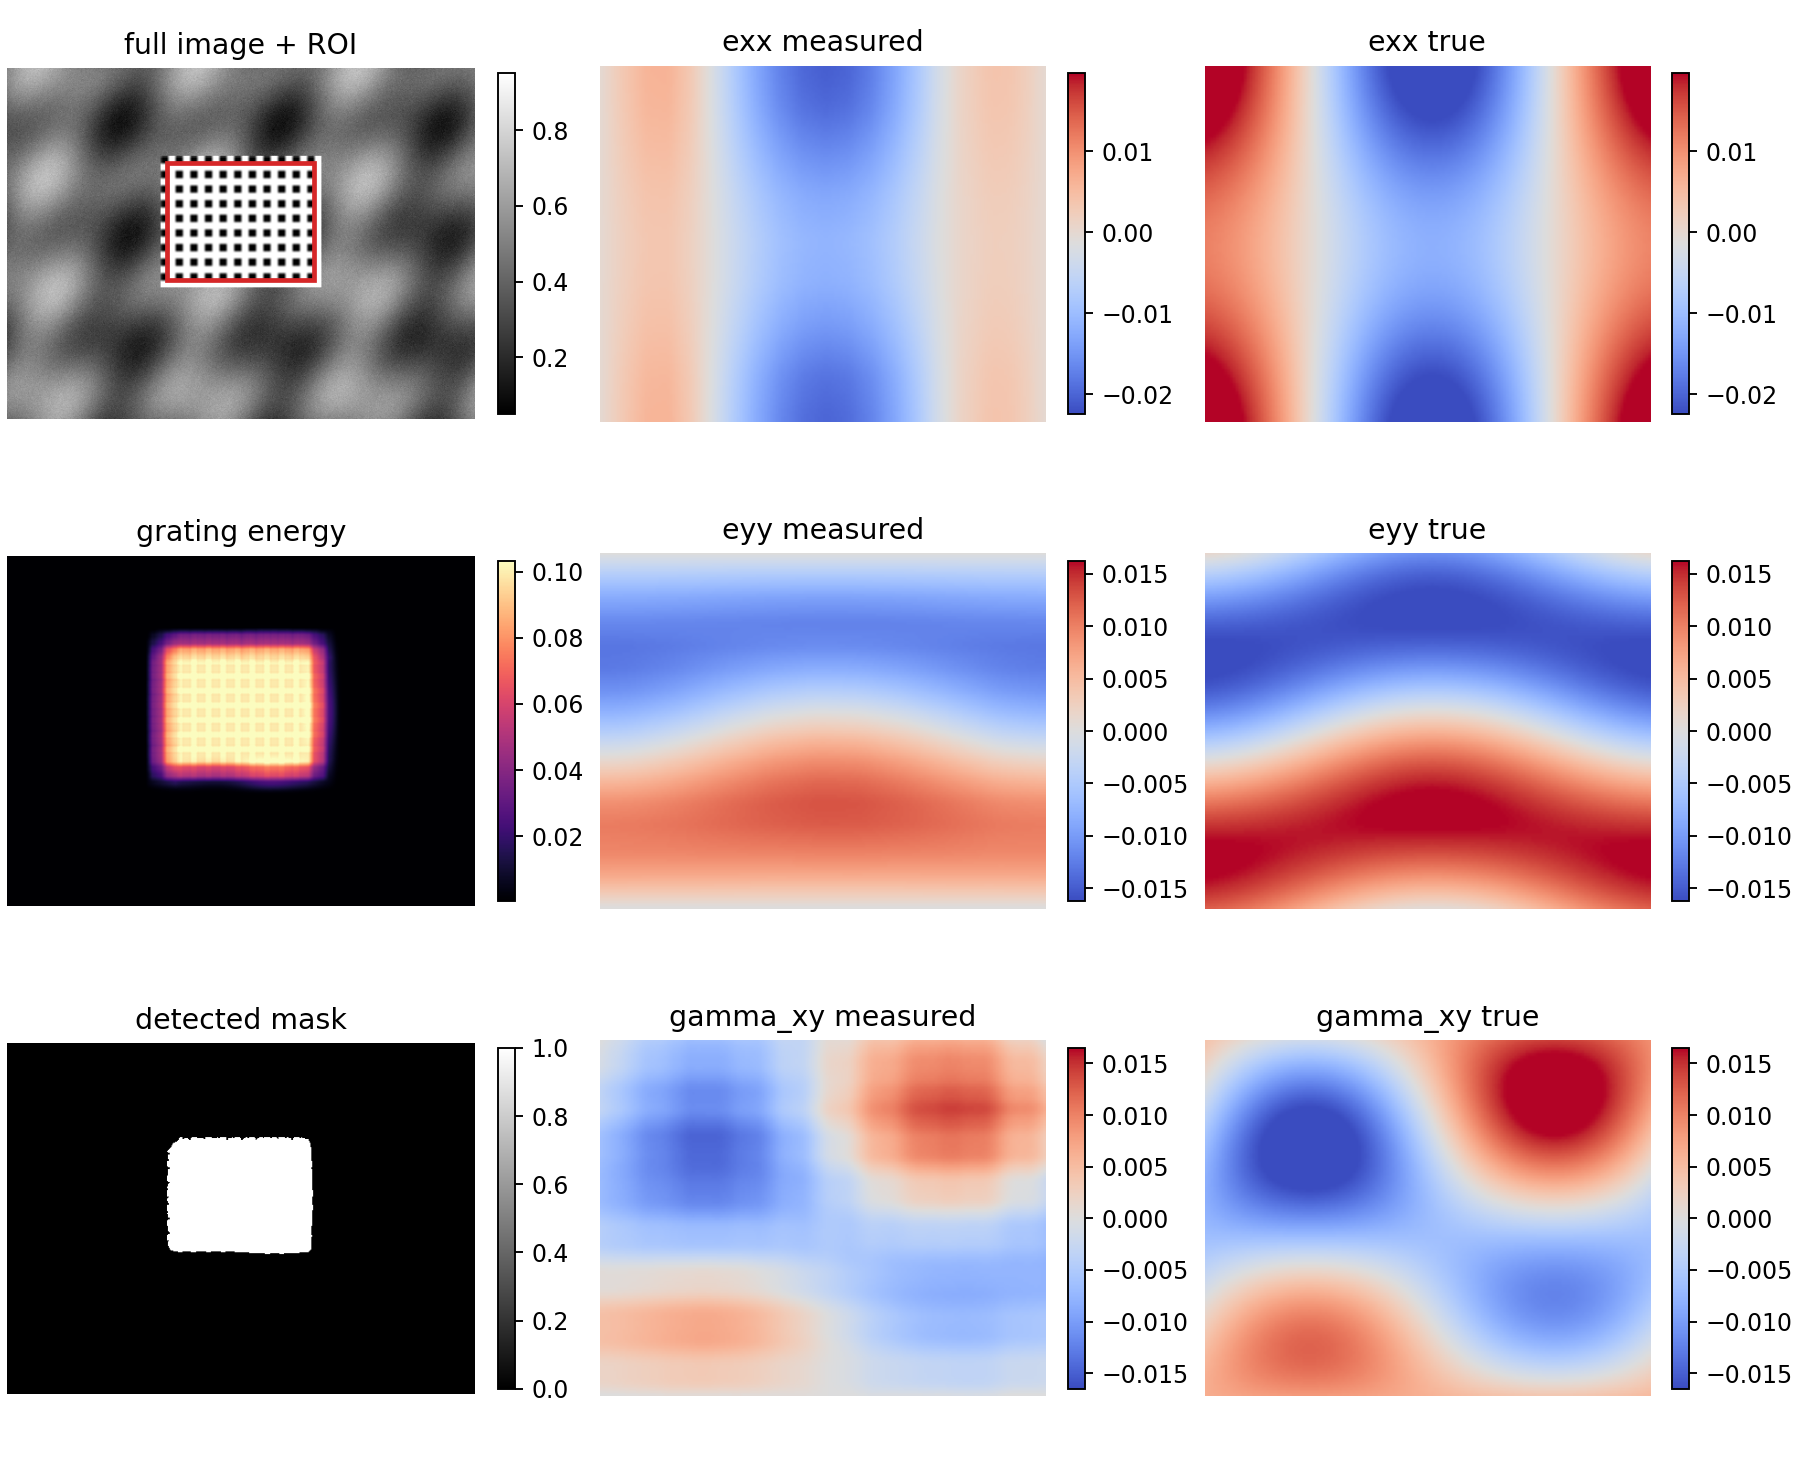
Result Figure
The figure below is the result shown in the README. The left column shows the detection process, while the remaining panels compare measured strain fields with the known synthetic truth.

Synthetic Data
The grid patch starts from an ideal square-marker target: black square markers arranged periodically on a white background. The captured image is simulated by sub-pixel averaging and a small blur, so the image is closer to a camera sample than a purely binary target.
The deformed image is generated by evaluating the same grid at coordinates shifted by known displacement fields:
u(x, y)
v(x, y)
Because these displacement fields are known, the ground-truth strain fields can be calculated directly from their gradients:
exx      = du/dx
eyy      = dv/dy
gamma_xy = du/dy + dv/dx
This gives a controlled validation case. The algorithm does not just produce a plausible-looking strain map; it can be compared against the exact synthetic answer.
Sampling Moire Phase Analysis
For each analysis direction, moirestrain creates phase-shifted sampling moire images from a single grating image. For each sampling offset, it samples pixels every period pixels and linearly interpolates the sampled image back to the original image grid.
The resulting stack is treated as a set of equally phase-shifted images:
I_k = a + b cos(phi + 2*pi*k/N)The wrapped phase is estimated from the first Fourier component:
phi = atan2(
    -sum_k I_k sin(2*pi*k/N),
     sum_k I_k cos(2*pi*k/N)
)
The displacement component along the analyzed grating direction is then calculated from the phase difference between the deformed and reference images:
u = (Delta phi / 2 pi) * pHere p is the grating pitch. If the pitch is given in pixels, the displacement is returned in pixels.
ROI Detection
A practical point in this example is that the grid does not cover the whole image. The script first computes a grating-energy map, then detects the dominant grid region from that map. The detected ROI is then cropped and passed to the grid analysis pipeline.
For the default example run, the detected bounds were:
(y0, x0, y1, x1) = (103, 175, 231, 335)This means the analysis can start from a larger image and focus only on the part where the periodic target is actually present.
Numerical Check
I ran the default example with:
PYTHONPATH=src python examples/partial_grid_detection_analysis.py \
  --output-dir /tmp/moirestrain-partial-article \
  --no-figure
The run reported:
| quantity | value |
|---|---|
| detected bounds | (103, 175, 231, 335) |
| strain smoothing window | 49 px |
| valid margin | 48 px |
| mean |exx error| | 5.551054e-04 |
| mean |eyy error| | 1.641202e-03 |
| mean |gamma_xy error| | 1.408642e-03 |
The error is evaluated only in an inner valid ROI. This is important because phase analysis, smoothing, and numerical differentiation are all less reliable near the image boundary.
Python API
At the high level, the grid analysis looks like this:
from moirestrain import analyze_grid, recommended_strain_smoothing_window

period = 16
strain_window = recommended_strain_smoothing_window(period, cycles=3)

result = analyze_grid(
    reference_roi,
    deformed_roi,
    period=period,
    strain_smooth_window=strain_window,
)

u = result.x.displacement
v = result.y.displacement
exx = result.strain.exx
eyy = result.strain.eyy
gamma_xy = result.strain.gamma_xy
The ROI detection step can be done with the helper functions used in the example script:
from moirestrain import detect_grating_roi, crop_grating_roi, grating_energy

energy = grating_energy(reference_image, period=period)
roi = detect_grating_roi(reference_image, period=period)

reference_roi = crop_grating_roi(reference_image, roi)
deformed_roi = crop_grating_roi(deformed_image, roi)
Why This Example Matters
This example is useful because it tests several things at once:
- the grid patch can be detected inside a larger image,
- the detected ROI can be analyzed without manually cropping the input,
- the x and y components of a square-marker grid can be separated,
- phase differences can be converted to full-field displacement,
- strain can be estimated and compared against known truth.
It is still a synthetic example, but it is a useful stepping stone between a clean academic phase example and a more practical image-analysis workflow.
Reproduction
The example can be reproduced with:
PYTHONPATH=src python examples/partial_grid_detection_analysis.pyThis writes the result arrays and figures under data/ by default, including:
partial_grid_detection_result.npzpartial_grid_detection_analysis.pngpartial_grid_strain_measured_true.pngpartial_grid_exx_comparison.pngpartial_grid_eyy_comparison.pngpartial_grid_gamma_xy_comparison.png
The README figure is based on this workflow.